🗺️ Flow Map
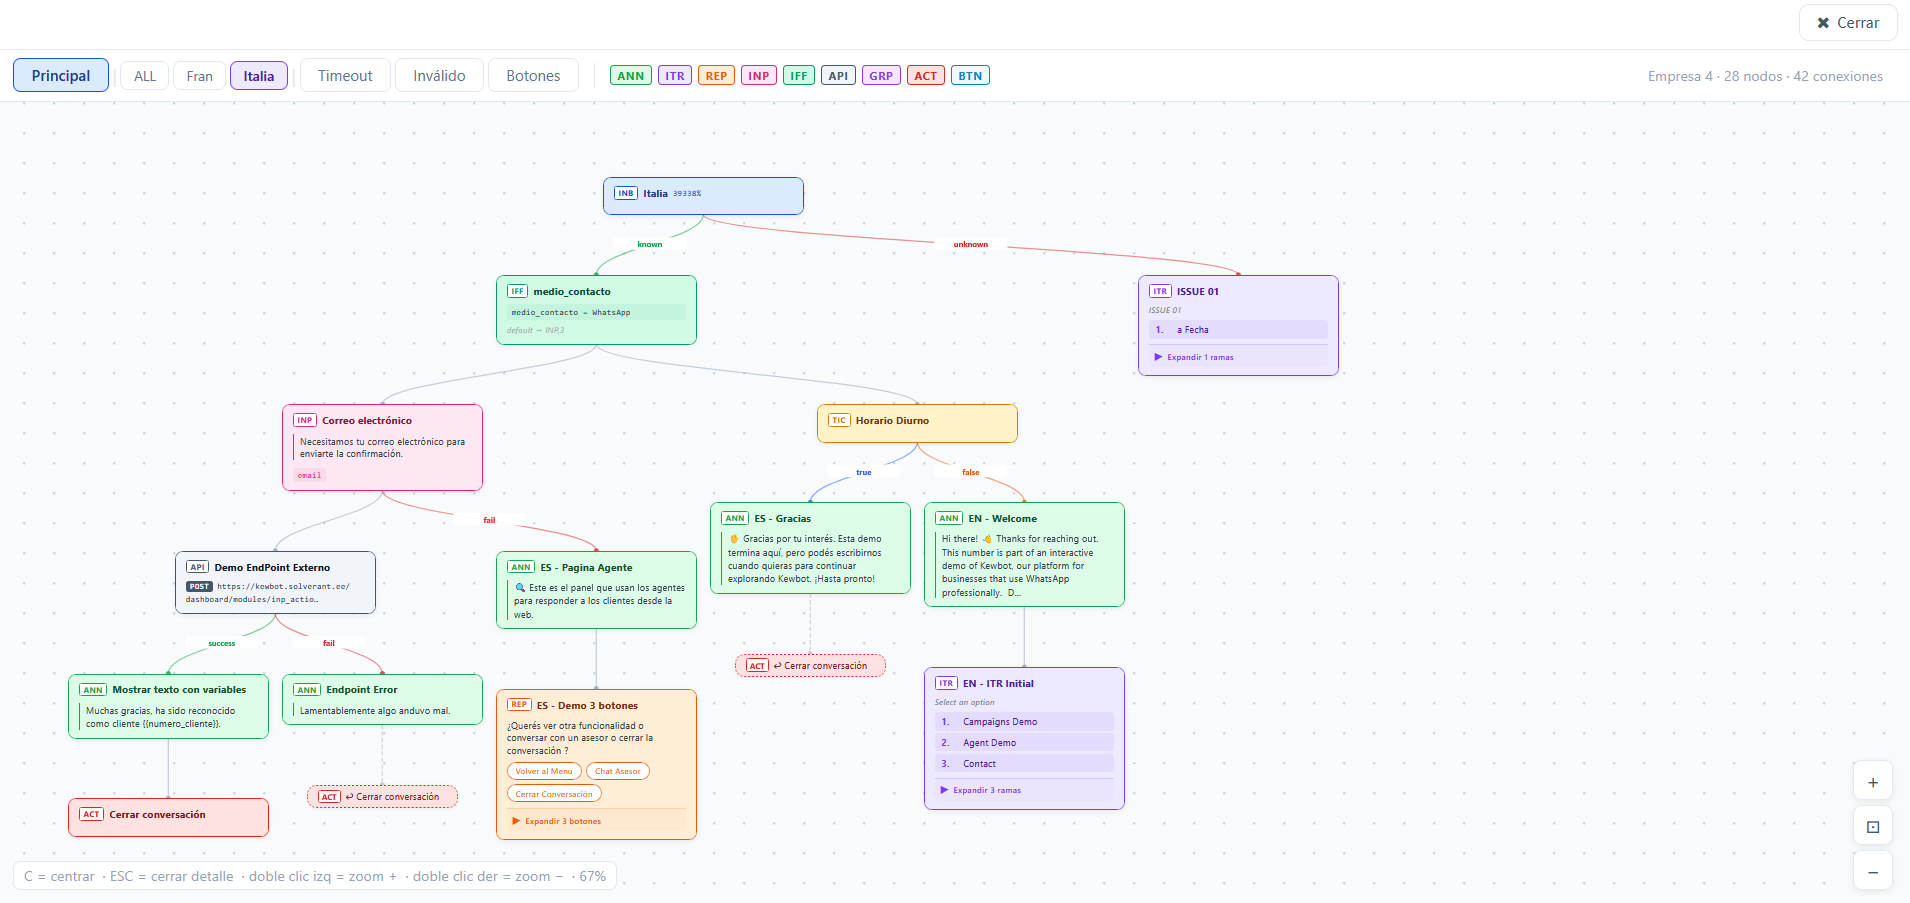
The Flow Map is a visual tool that lets you see the complete conversation flow configured for your company — exactly how a customer moves from the first message to the final destination.
Instead of reading through settings one by one, the Flow Map renders everything as an interactive graph: nodes connected by arrows, each representing a step in the automation.
🧭 What is it for?
The Flow Map answers questions like:
- What happens when a customer writes for the first time?
- Which menu options lead where?
- Are there paths that go nowhere or loop back?
- Which groups receive conversations from which routes?
- What does the timeout or invalid input flow look like?
It is useful for administrators, supervisors, and anyone responsible for configuring or auditing the company's automation.
📐 Views
The Flow Map offers four views, selectable from the toolbar at the top:
🔵 Main
Shows the complete operational flow starting from each configured Inbound Route (INB).
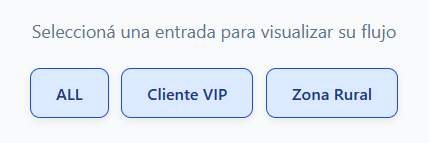
If multiple inbound routes exist, each appears as a separate column. You can select a specific route from the top bar to focus on that flow only.
Each route displays its full tree: announcements, interactive menus, conditions, agent groups, inputs, and API calls — everything connected as configured.
⏱️ Timeout
Shows the flows triggered when a conversation has been inactive for too long.
Kewbot supports three timeout levels:
| Level | Color | Typical use |
|---|---|---|
| Soft | 🟢 Green | First warning — short inactivity |
| Medium | 🟡 Yellow | Second warning — medium inactivity |
| Critical | 🔴 Red | Final action — long inactivity |
Each level shows its configured time in minutes and whether it resends the last message.
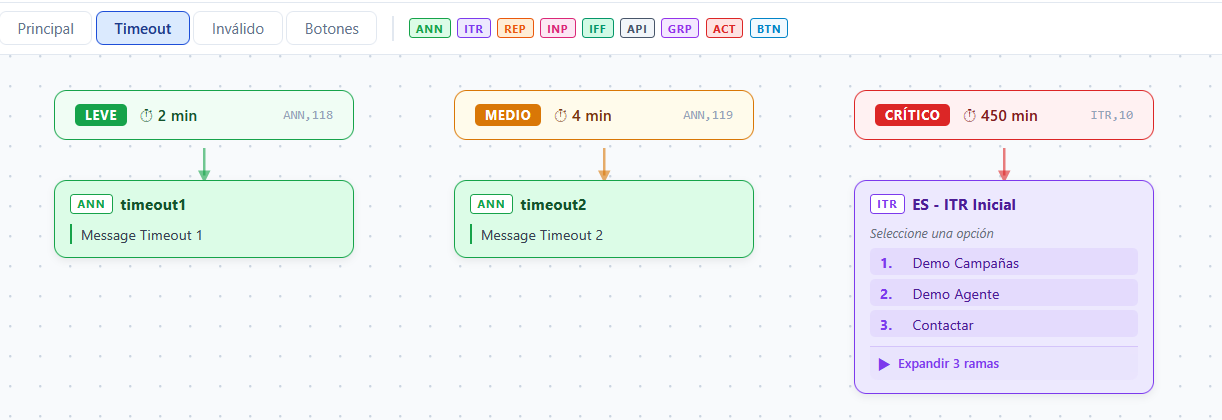
If a level has no destination configured, it will not appear in this view.
❌ Invalid Input
Shows the flows triggered when a customer sends an invalid response (wrong format, unexpected text, etc.).
Same three-level structure as Timeout: Soft, Medium, Critical.
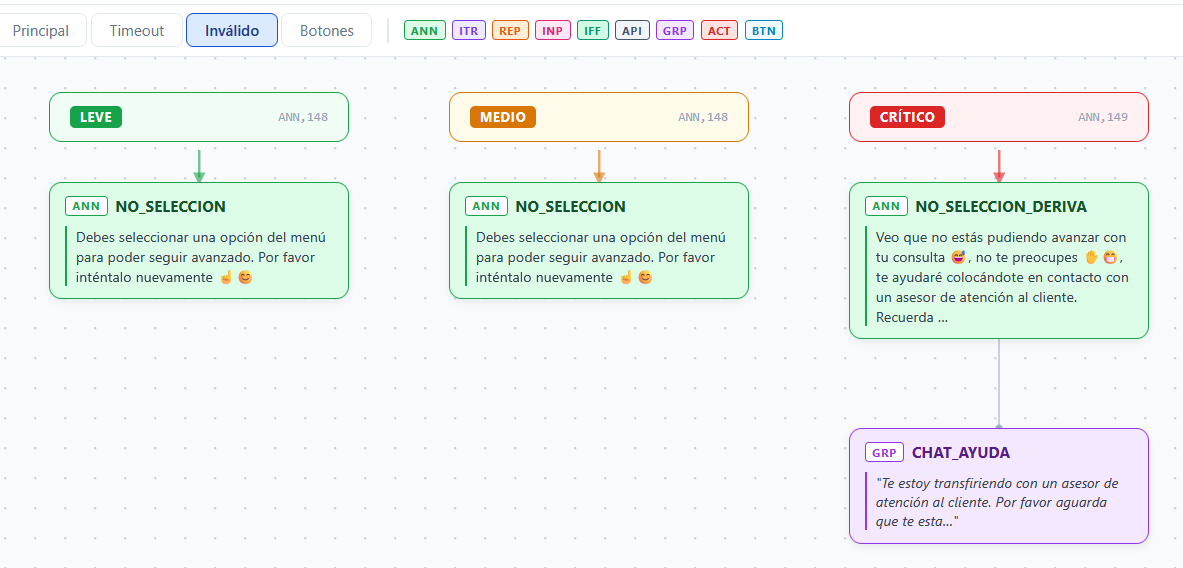
If no invalid input flows are configured, this view will be empty.
🔘 Buttons
Shows all template button routes configured for the company.
When outbound campaigns use templates with buttons, each button can be configured to route the customer to a specific flow when tapped. This view renders all those buttons and their complete destination trees side by side.
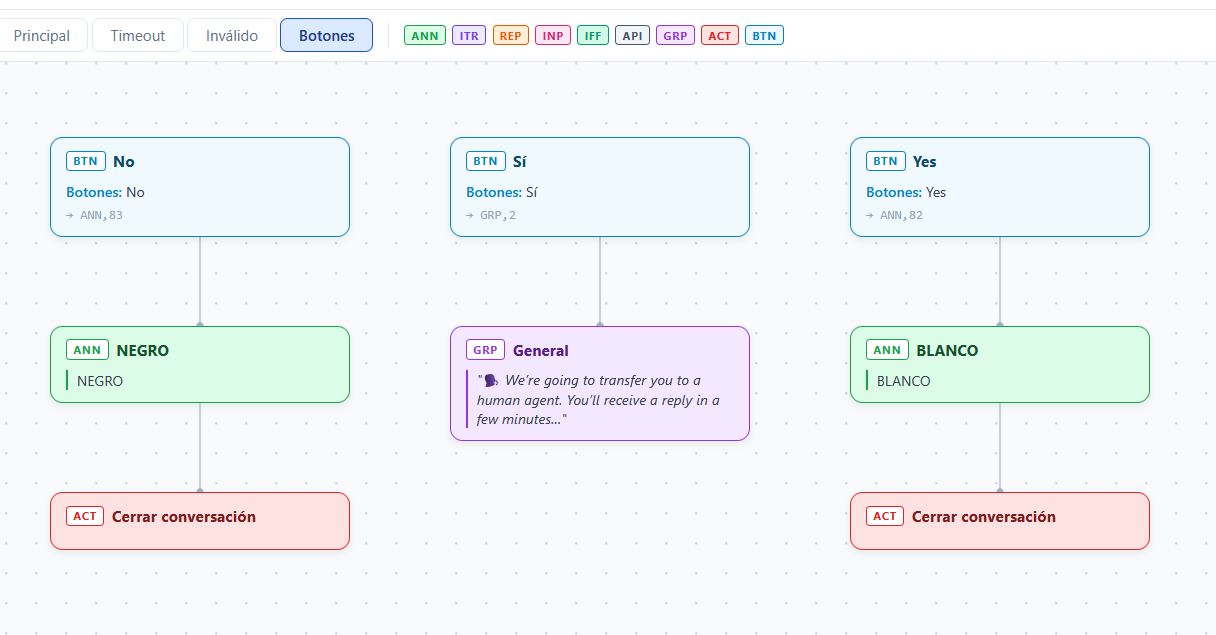
This is the fastest way to audit all button destinations across all templates in use.
🎨 Node Types
Each element in the flow is represented by a colored card. The color and badge identify the node type at a glance:
| Badge | Type | Color | Description |
|---|---|---|---|
INB |
Inbound Route | 🔵 Blue | Entry point — incoming message trigger |
ANN |
Announcement | 🟢 Green | Sends a message to the customer |
ITR |
Interactive Menu | 🟣 Purple | Sends a list menu with options |
REP |
Button Reply | 🟠 Orange | Sends a message with up to 3 buttons |
INP |
Input | 🩷 Pink | Waits for free-text input from the customer |
IFF |
Condition | 🌿 Teal | Evaluates a variable and routes accordingly |
TIC |
Time Condition | 🟡 Yellow | Routes based on schedule/business hours |
API |
External Endpoint | ⚫ Gray | Calls an external API |
GRP |
Group / Agent | 🟣 Violet | Transfers conversation to an agent group |
TEM |
Template | 🔷 Indigo | Outbound message template |
BTN |
Template Button | 🔵 Light Blue | Button route from a template |
ACT |
Action | 🔴 Red | System action (e.g. close conversation) |
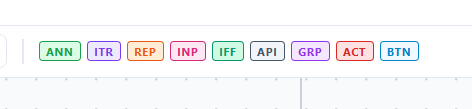
🔍 Chips — Referenced Nodes
When a node already appears elsewhere in the flow, it is not drawn again in full. Instead, it appears as a chip: a small dashed pill with an arrow icon (↩).
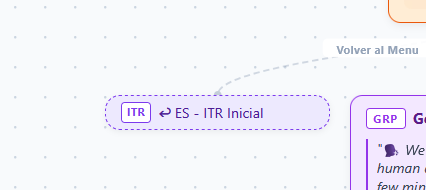
Clicking a chip jumps to and highlights the full node wherever it is in the canvas.
This keeps the graph readable even in complex flows where many paths converge on the same destination.
📋 Node Detail Panel
Clicking any node opens a detail panel on the right side of the screen.
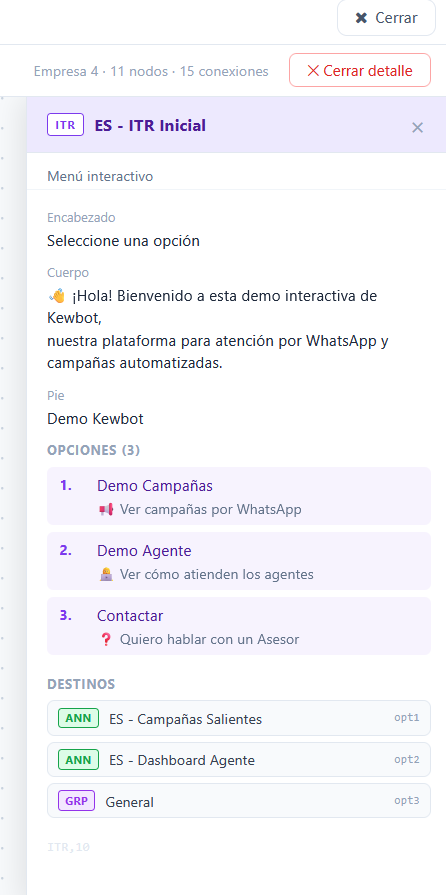
The panel shows the complete content of the node:
- For ANN: full message text, image indicator.
- For ITR: header, body, footer, and all options with descriptions.
- For REP: body text and all button labels.
- For INP: question text, validation rule, max retries, error message.
- For IFF: all rules with variable, operator, value, and destination.
- For API: method, URL, JSON setting.
- For GRP: welcome message sent to agent.
- For TEM: header, body, footer, and buttons.
- For all nodes: list of outgoing connections (destinations).
To close the detail panel: click ✕ Close detail in the toolbar, or press ESC.
📂 Expanding and Collapsing Branches
ITR and REP nodes with many branches can be collapsed to keep the canvas manageable.
Each ITR and REP node has an expand/collapse button at the bottom:
- ▶ Expand N branches — shows the subtree below this node.
- ▼ Collapse — hides the subtree, showing only the node itself.
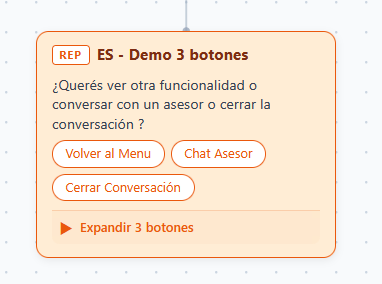
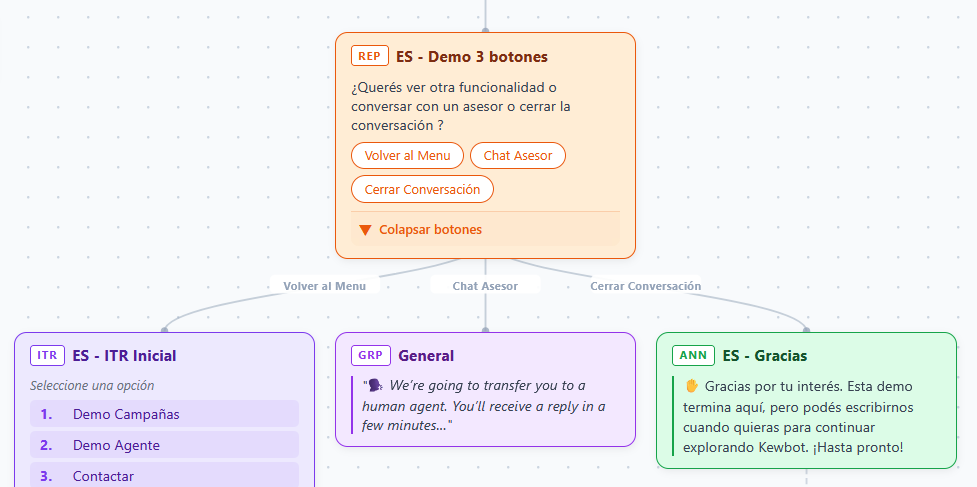
For complex flows, Kewbot automatically collapses nodes whose subtrees are large, to prevent the canvas from becoming unreadable on first load. You can expand any node at any time.
🖱️ Navigation and Zoom
| Action | Result |
|---|---|
| Click and drag | Pan across the canvas |
| Double-click left | Zoom in at cursor position |
| Double-click right | Zoom out at cursor position |
Press C |
Center and fit the entire flow in view |
+ / − buttons (bottom right) |
Zoom in / zoom out |
⊡ button (bottom right) |
Fit everything in view |
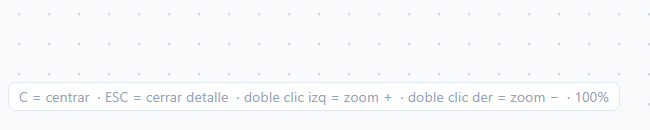
The current zoom level is shown as a percentage in the bottom-left corner alongside the keyboard shortcuts.
💡 Tips for reading complex flows
- Start from the top — follow the flow from INB downward.
- Use collapse/expand on large ITR and REP nodes to focus on one branch at a time.
- Click chips to find where shared destinations are positioned in the full graph.
- Press
Cafter opening to fit the entire flow in view if it loads off-screen. - Use the Timeout and Invalid views to quickly verify edge-case handling without searching through the main flow.