Conversation reports
Conversation reports show how the operation is doing: volume, times, message usage, and how the bot and agents are performing. Everything comes from real platform data and respects the date range and filters you apply.
How to use this guide
Each report shows a short code such as KR-SUM-03 next to its title, plus a ? icon that jumps straight to that code's section on this page.
Controls bar
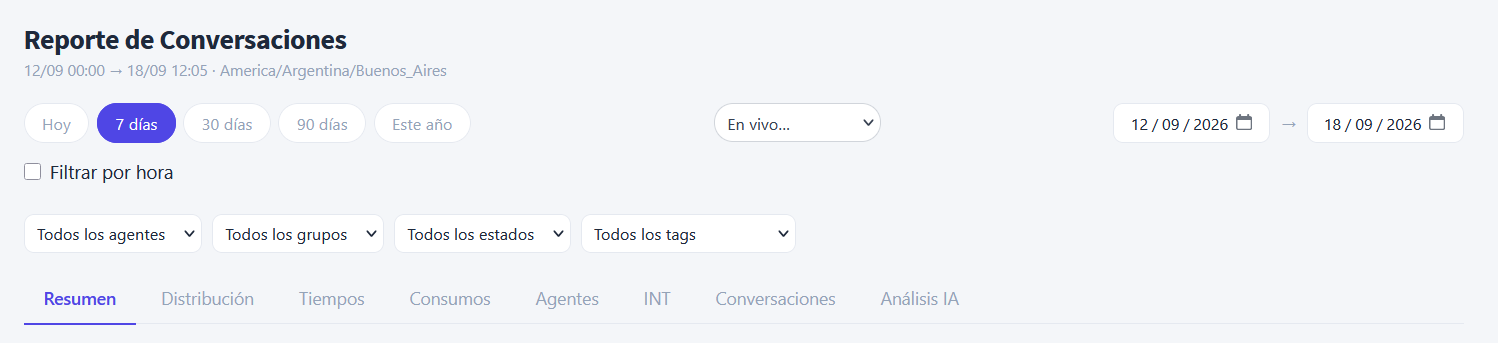
At the top you set what and when to analyze. The first line shows the effective range and the company's time zone. Below it:
- Quick presets: Today, 7 days, 30 days, 90 days, This year, and a Live… selector (5 min, 15 min, 1 hour, today so far) to watch the present moment.
- Custom range: the two date pickers on the right, and Filter by hour to narrow to an hourly window within each day.
- Global filters: agent, group, status and tag. They apply to every report at once.
Range vs. moment
Most reports are computed over the selected range. A few are a snapshot of the present moment (current state) and don't depend on the range: each one is marked with as of now.
Overview
General summary

The headline numbers for the range: Started (conversations that began), Closed, Avg. handling time, Messages (inbound + outbound) and From template (what share of conversations began because the company sent a template, rather than the customer writing first).
Read them as the general pulse of the period. A high "From template" points to an operation that reaches out to customers (campaigns, follow-ups) rather than one that only responds. Average handling time includes long conversations that stayed open for days, so treat it as a reference, not as the length of a typical conversation.
Conversation flow
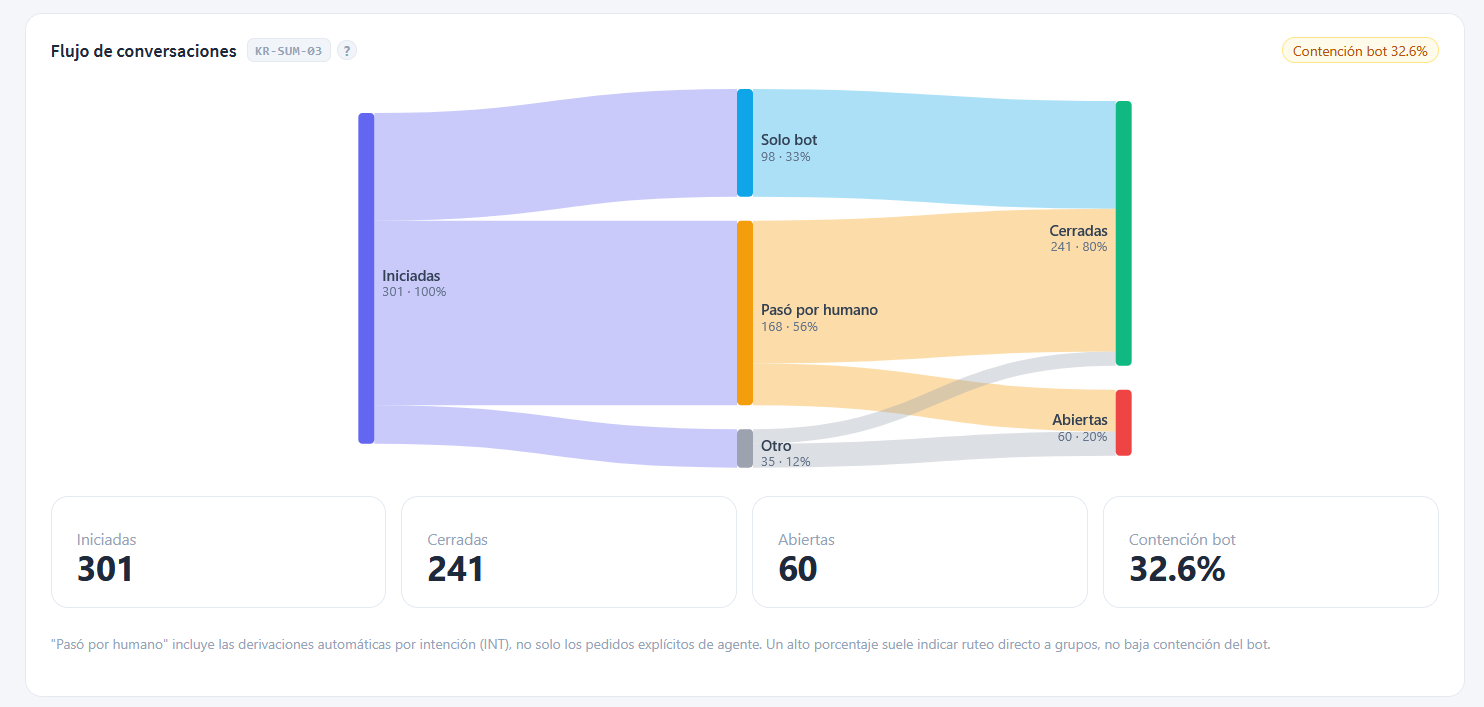
A funnel of each conversation's path, left to right: Started → (Bot only / Reached a human / Other) → (Closed / Open). Each band's width is proportional to volume, and each node shows its total and percentage. The Bot containment badge at the top right is the share the bot closed on its own. It's deterministic: built from each ticket's real path, no AI.
Read it by following the thickness of the bands. Heavy flow through "Bot only → Closed" is healthy automation. Heavy flow through "Reached a human" isn't necessarily bad, but it's worth understanding why (see the note). The "Other" band is conversations without a clear path (the bot handled them without closing or routing).
How to read 'Reached a human'
It includes automatic routing by intent (INT), not only when the customer asks for an agent. A company that routes almost everything through INT to groups will see a high "Reached a human" even when the bot is classifying perfectly. A high percentage usually means direct routing to groups, not low bot containment.
By agent
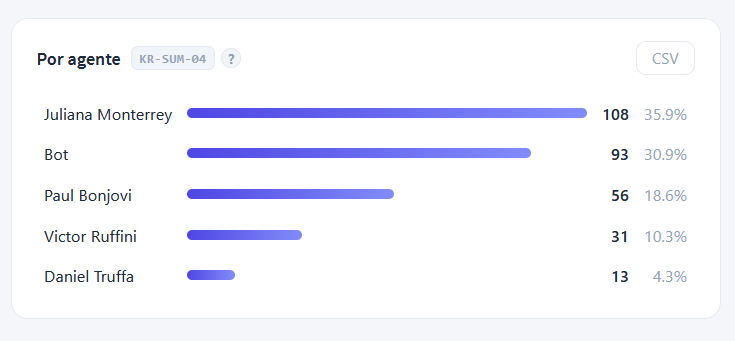
How many conversations each agent handled in the range, highest to lowest, with the count and the percentage of the total. The Bot appears as one more "agent", so you can see at a glance how much automation resolved versus the agents.
Useful for sizing load and spotting imbalance: an agent well above the rest may be overloaded, or the only one covering a shift.
By group
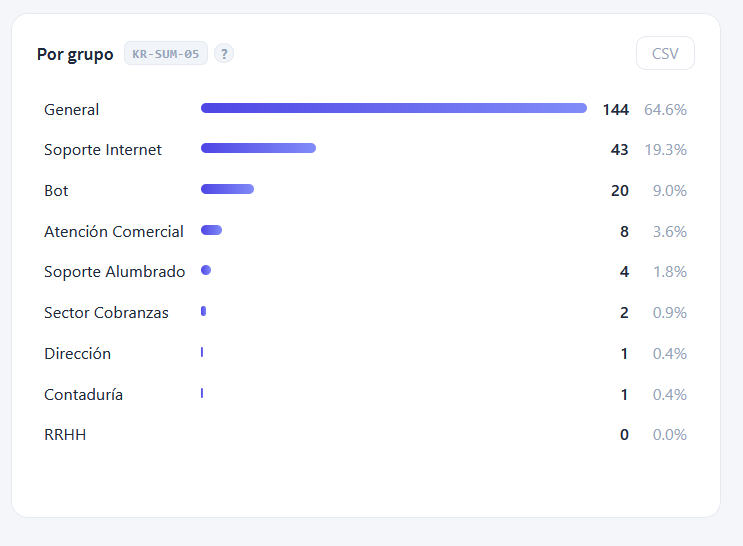
The same as above but by group (General, Support, Collections, etc.). It shows where volume goes within the company's structure.
A group taking most of the traffic is a candidate to reinforce; one at zero may be a mis-routed group or simply unused.
Current state
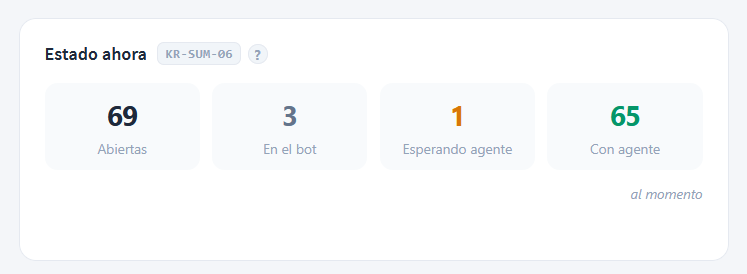
A snapshot of the present moment, not the range. Of the conversations open right now: how many are Open in total, how many are In the bot, how many are Waiting for agent (already in a group, not yet picked up) and how many are With agent.
It's an operational read of "how things stand right now". The number to watch is Waiting for agent: if it grows, customers are queued without attention.
Attention status
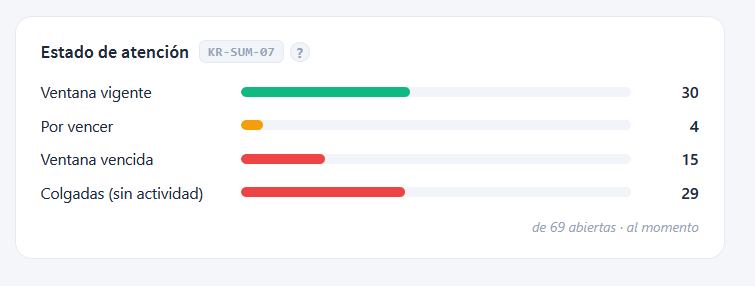
Also a snapshot. Of the conversations open now, the state of Meta's 24-hour window: Active (green, you can reply freely), Expiring soon (orange, a few hours left), Window expired (red, you can no longer reply without a template) and Stale (red, open with no activity for a while). The footer states how many open conversations it is computed over.
This is the conversation-management block. Expiring soon are the urgent ones: reply before the window closes. Window expired and Stale are conversations left unresolved, worth closing or re-engaging with a template.
Distribution
Heatmap · day × hour
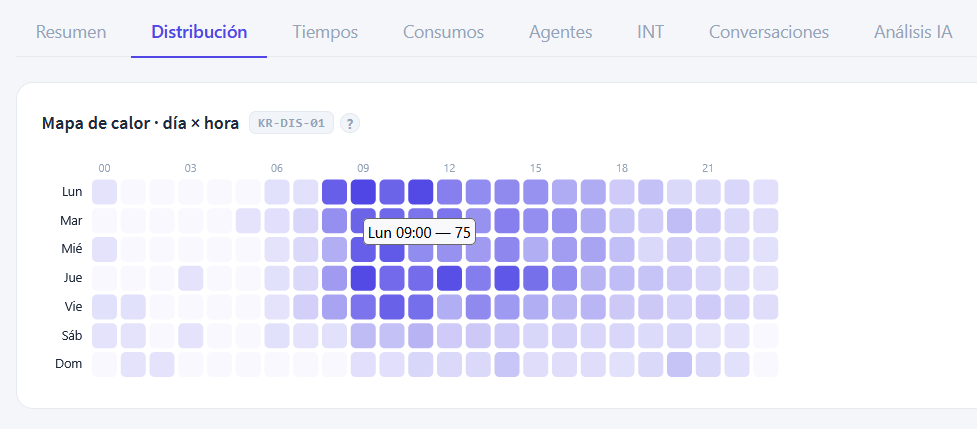
A 7-day × 24-hour matrix. Each cell is a weekday and an hour; the darker it is, the more conversations fell in that slot. On hover, the tooltip shows the exact value (for example, Mon 09:00 - 75).
Read it by looking for the dark patches: that's where demand peaks. It feeds directly into sizing shifts and deciding which slots need more people or where the bot has to manage on its own.
Conversations by hour

The same read as the heatmap, but collapsed to the 24 hours of the day, without splitting by weekday. A strip of cells from 00 to 23; darker means more volume. The tooltip gives the total per hour (for example, 09:00 - 348).
Useful when you only care about the average hourly curve: when demand opens, where the peak is, when it drops.
By weekday
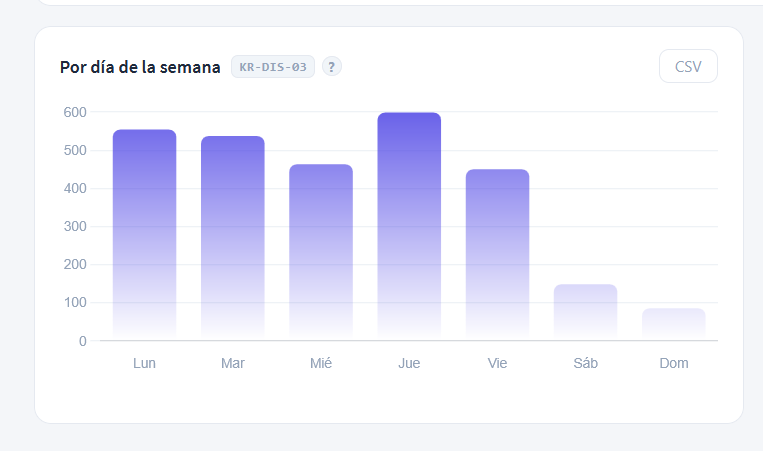
A bar chart with the total conversation volume per day, Monday to Sunday.
It shows the weekly pattern at a glance: which days concentrate the load and how much it drops on weekends. It helps plan coverage and campaigns (better not to launch a large send on the day of highest spontaneous demand).
By reason / tag
Distribution of conversations by the tag assigned to them, in horizontal bars.
This is the "why they write" read. It requires agents to assign tags after a conversation. Concentration in a few tags tells you where to focus (more automation, more people, better answers).
Company without tags
If the company doesn't use tags, this block appears empty (as in the screenshot). It's not an error: there's nothing to distribute. The same applies to the tag filter in the controls bar.
Times
The Times tab measures the pickup SLA: how long a conversation waits from the moment it enters a group until an agent picks it up and responds. It only counts the ones that reached a human agent; what the bot resolved doesn't appear here.
Pickup time (SLA)
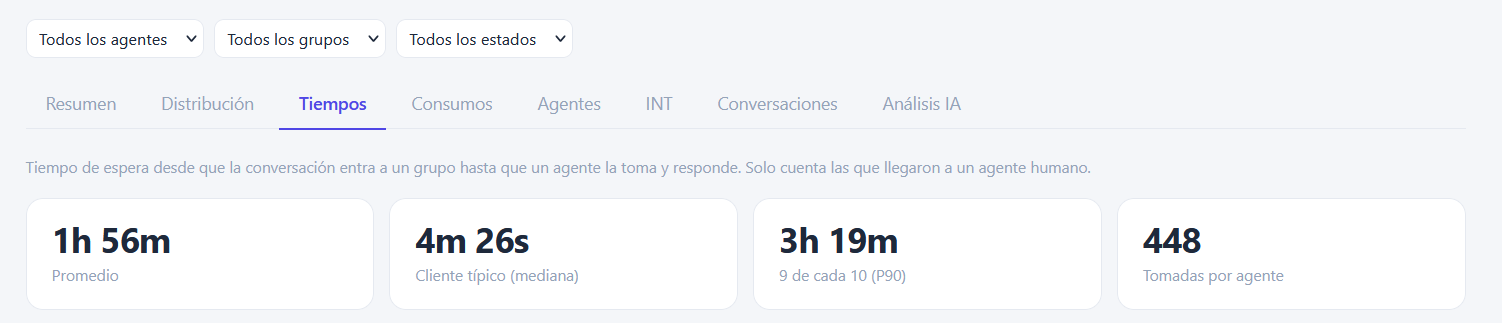
The four headline numbers: Average (inflated by some extreme case, take it with reserve), Typical customer (median) - half waited less than shown, 9 out of 10 (P90) - the realistic worst case, 90% waited less - and Picked up by agent (how many conversations entered the calculation).
The honest read is median + P90, not the average. The median tells you the usual experience; the P90, how bad it gets in the worst cases. If the median is low but the P90 high, most are handled quickly but some cases sit waiting for a long time.
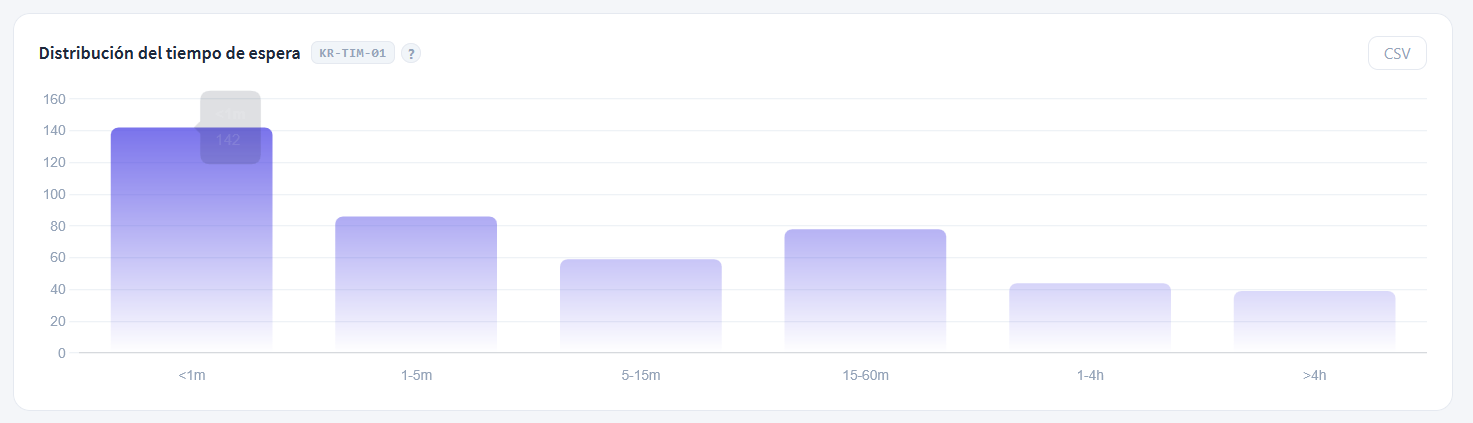
The histogram spreads conversations into wait buckets (<1m, 1-5m, 5-15m, 15-60m, 1-4h, >4h). The more it's loaded to the left, the better: most are picked up quickly. High bars to the right (>4h) are customers who waited too long.
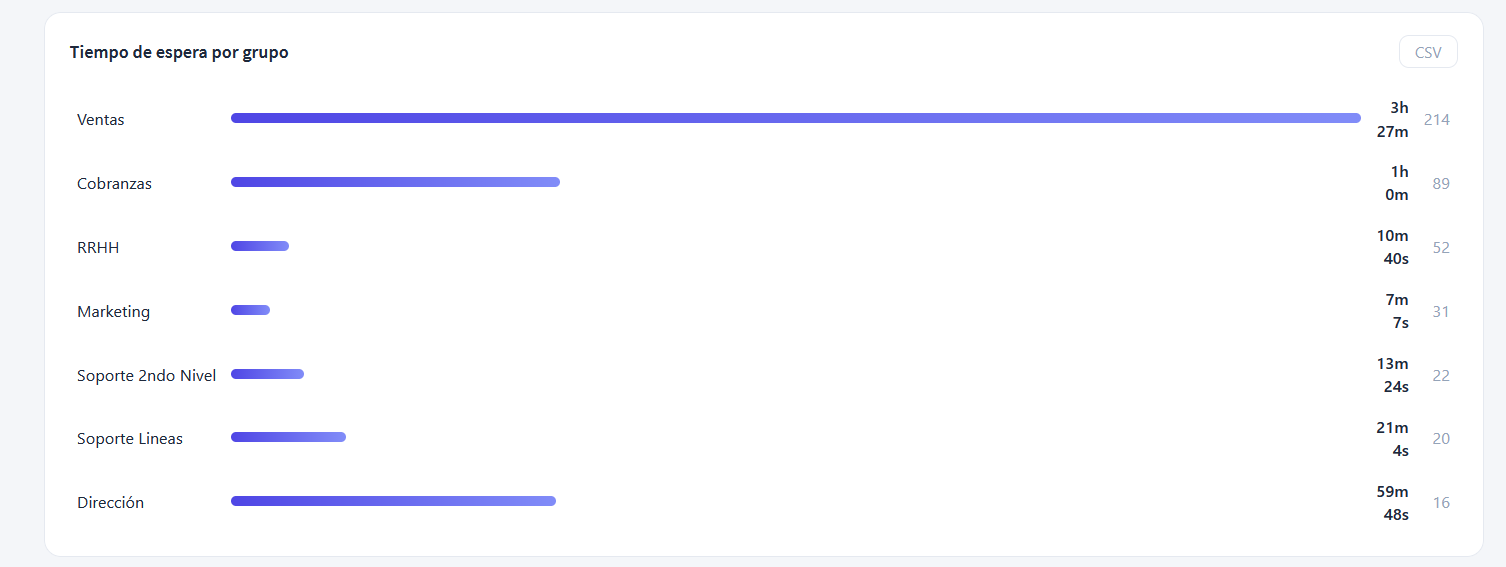
The same wait time broken down by group, with the average wait (the bar and the time) and the number of conversations picked up (the grey number on the right). It's useful for locating the bottleneck: a group with wait far above the rest needs more people or better routing. Be careful crossing wait and volume: a high wait over few cases weighs differently than over many.
Accuracy of median and P90
They are exact when the range runs in "live" mode (short ranges). On long ranges that read the aggregated history there are no raw values stored: the median falls back to a value approximated by buckets and the P90 is not available.
Follow-up
Customer re-engagement and abandonment over the range: re-engagements (reopened conversations), abandonments (the customer stopped responding) and transfers, each with its percentage.
This is the "what happened next" read. Many abandonments may point to slow responses or flows that don't resolve; many re-engagements, an operation that handles follow-up well.
Usage
What Usage measures
Volume of messages that generates cost on Meta. Service = outbound messages that aren't templates (Meta bills them as service from October 2026). Templates = campaigns + manual sends by agents to reopen a conversation.
Usage
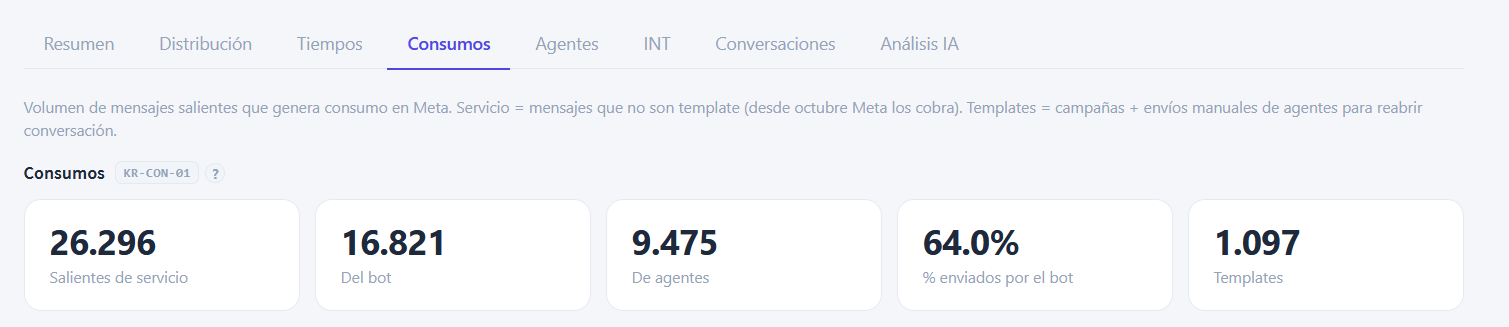
The totals for the range: Service outbound (total), how many the bot sent, how many the agents sent, the % sent by the bot and the total Templates.
Read it as the volume that drives cost. The templates total is separate because it has a different rate and logic (campaigns and follow-ups).
Service outbound by day
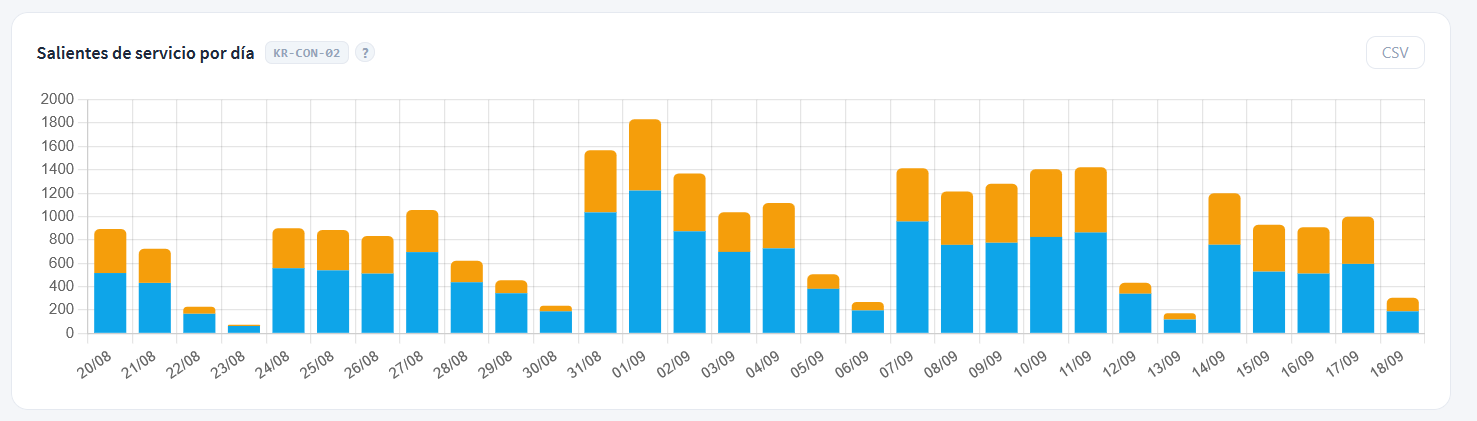
Daily series of service outbound, in stacked bars: bot (light blue) at the bottom, agents (orange) on top. Each bar is a day in the range.
It shows the trend and who generates the volume day by day. Peaks aligned with campaigns or events are expected; a sustained step up in the orange part means agents are sending more and more by hand.
Service outbound by agent
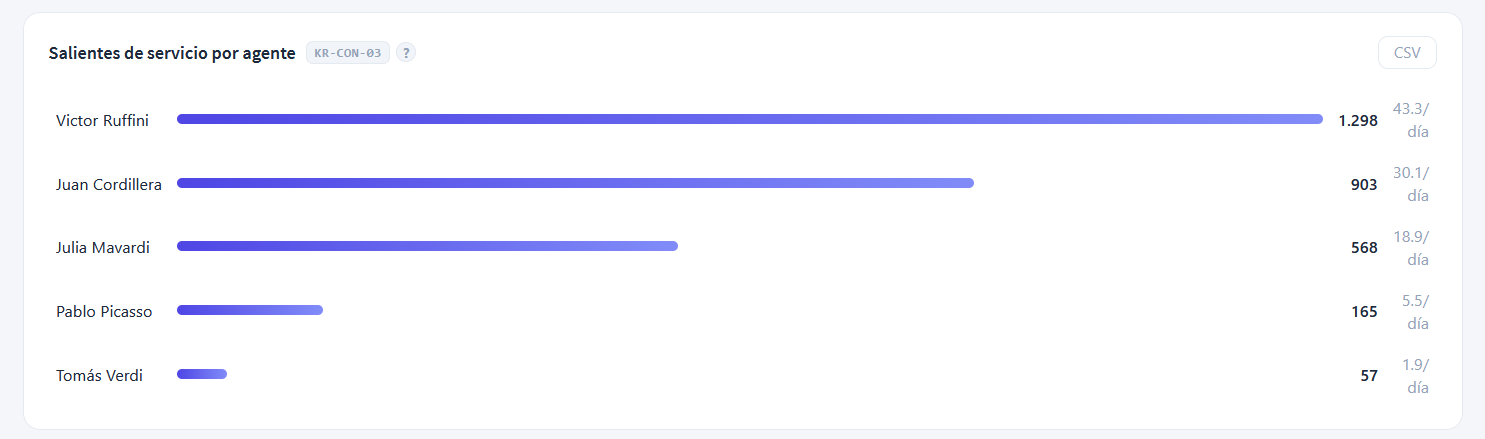
Ranking of service outbound by agent, with the total for the range and the per-day average on the right. The per-day average is computed over every day in the range, so you compare fairly even if one agent worked more days than another.
Useful for seeing who carries the volume and spotting imbalances. A very high daily average may be real productivity or a lack of automation in that agent's conversations.
Templates by day
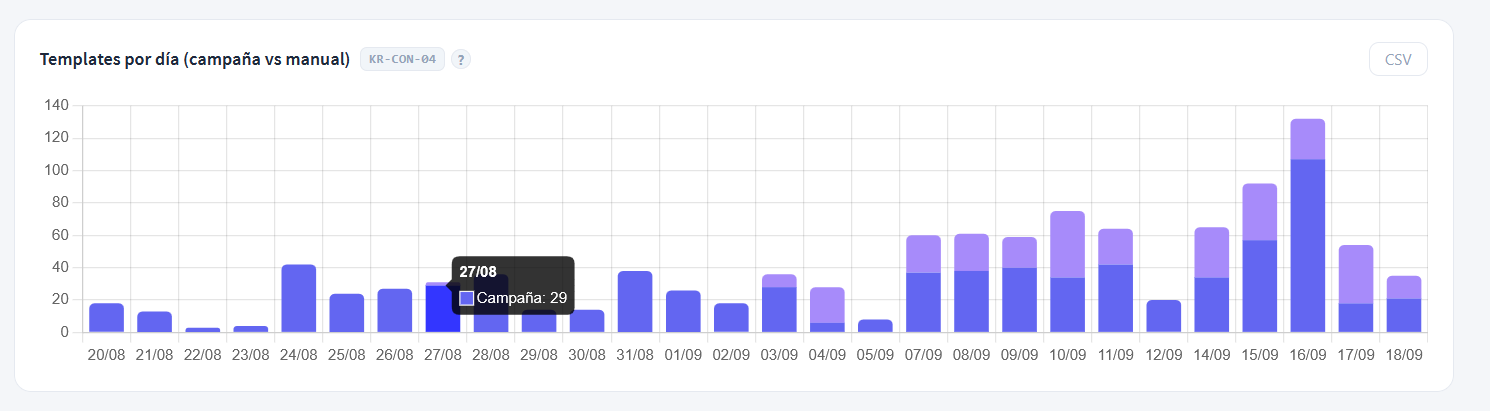
Templates sent per day, stacked between Campaign and Manual. Campaign are the scheduled bulk sends; Manual are the follow-ups an agent triggers to reopen a conversation outside the 24-hour window.
Splitting the two matters because they have different origins: the campaign part is controlled by marketing; the manual part, by the operation. A sustained manual peak may indicate many conversations left to expire that then have to be reopened.
Manual templates by agent
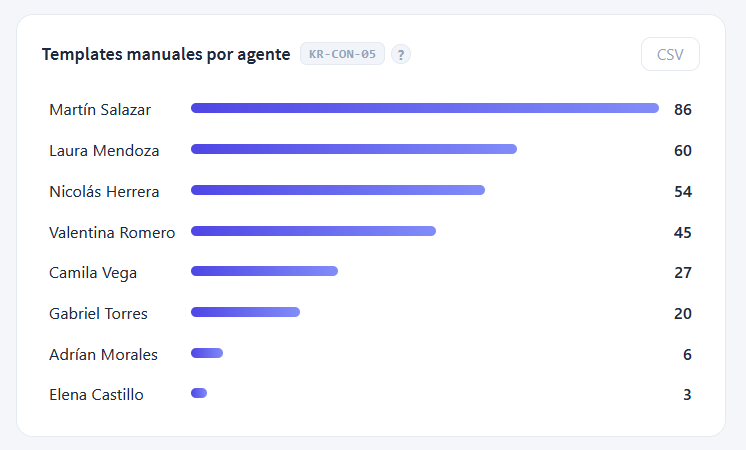
Ranking of how many manual templates (follow-ups) each agent sent in the range.
It shows who reopens the most conversations. High numbers may be good follow-up or, conversely, a sign that this agent lets many windows expire and has to reopen them with a template.
Campaigns in range
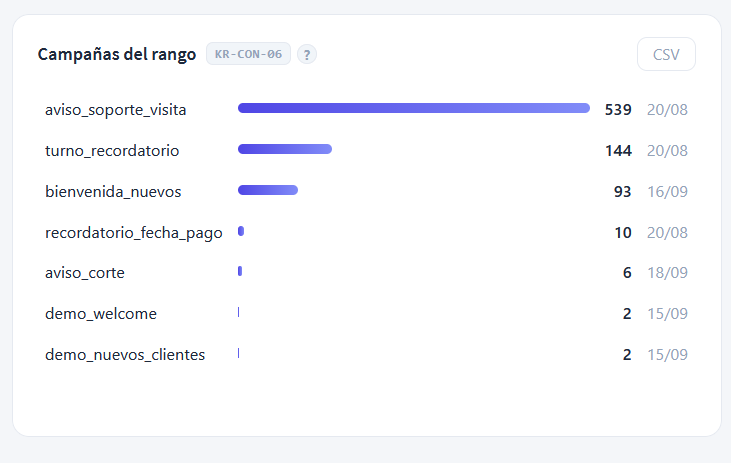
The campaigns that sent within the range, with their volume and the date of the first send. It's the "by campaign" counterpart of the templates block: which specific campaigns moved the volume.
Conversations
Conversation list
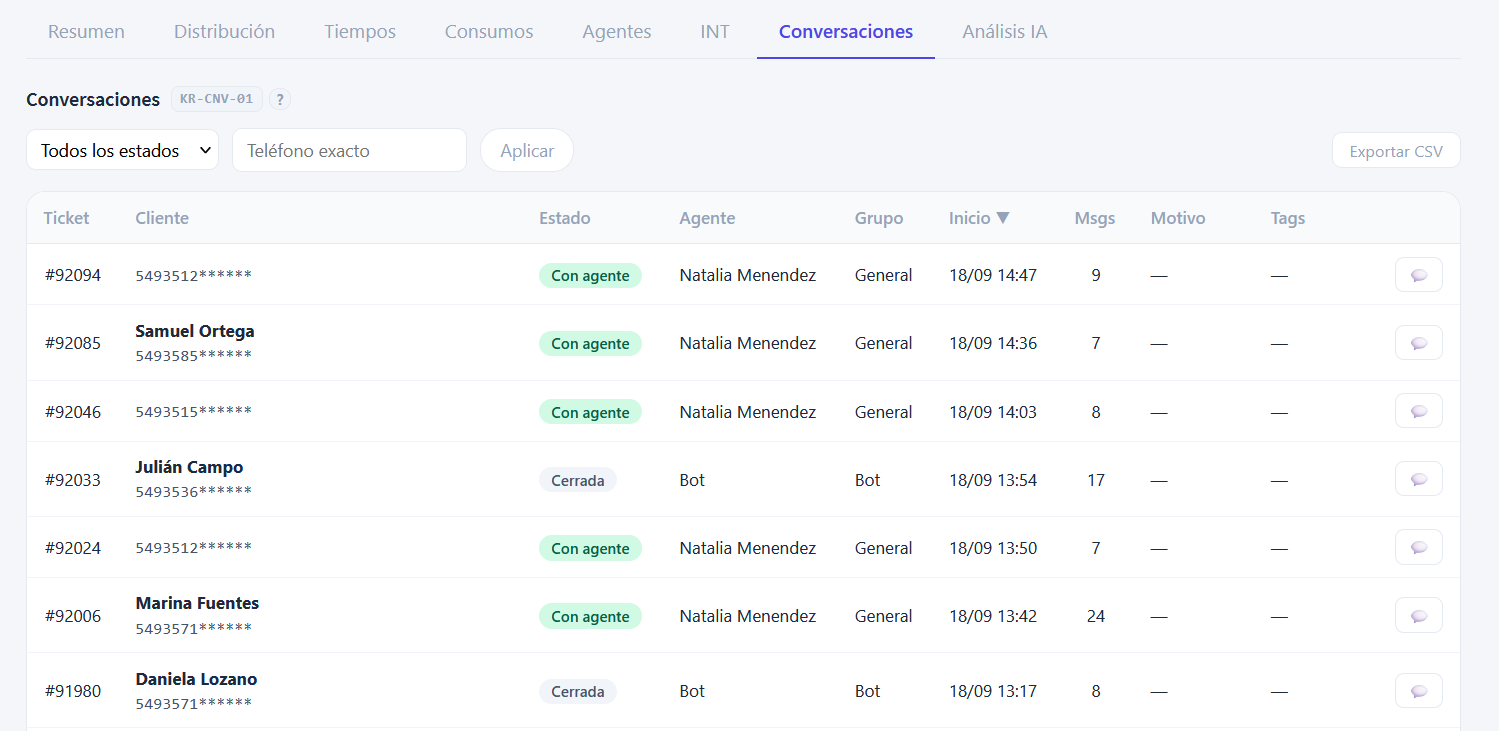
The detail, conversation by conversation, for the range. Each row carries the ticket number, the customer (name if in the phonebook, otherwise the phone number), the status (Waiting / With agent / Closed), the agent and group holding it, the start time, the message count, the reason and the tags. The icon on the right opens the full thread, with its AI summary.
It filters by status and by exact phone number, and sorts by the columns. It's the view for going from statistics down to specific cases: finding a particular conversation, checking why one stayed open, or auditing the work on a specific customer. The Export CSV button downloads the full list for the range.
Agents
Agent activity
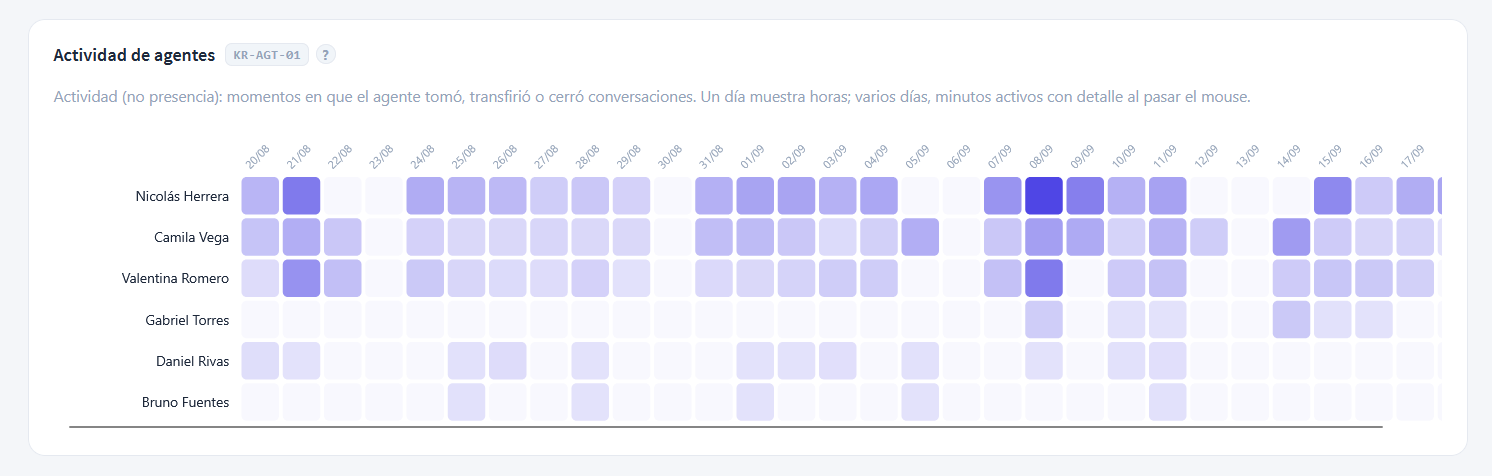
An agents × days matrix. Each cell marks that agent's activity that day - moments when they picked up, transferred or closed conversations; the darker, the more activity. On hover you see the detail (on a single day, by hours; over several, active minutes).
Activity, not presence
It marks when the agent acted on conversations, not how long they were logged in. A light cell doesn't mean "absent": they may have been available with no assigned cases. Read it as work intensity, not attendance control.
Useful for spotting patterns: who sustains the operation day to day, who works in bursts, which days coverage ran thin.
INT (intent detection)
The INT tab shows how the intent engine classified free-text messages: how many it understood, how many fell with no match, and what happened with the ones it couldn't route on the first attempt.
Classification summary
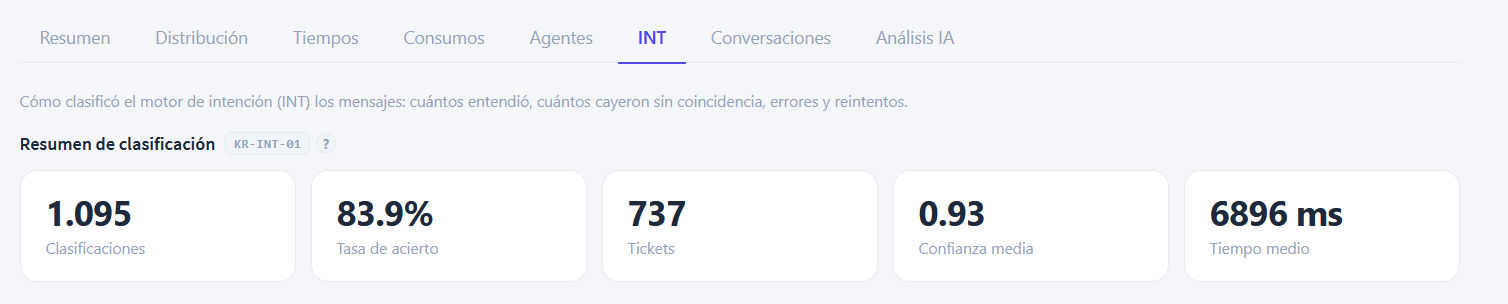
The engine's KPIs: Classifications (how many messages it analyzed), Match rate (what percentage routed to a destination), Tickets affected, Average confidence (how sure it was, 0 to 1) and Average time for the engine to respond.
The match rate is the coarse metric, but it underestimates the real result: it doesn't count that a message that failed on the first try often recovers on a retry (see KR-INT-04). Average confidence and time are health signals: low confidence suggests intent descriptions that are too generic.
Classification outcome
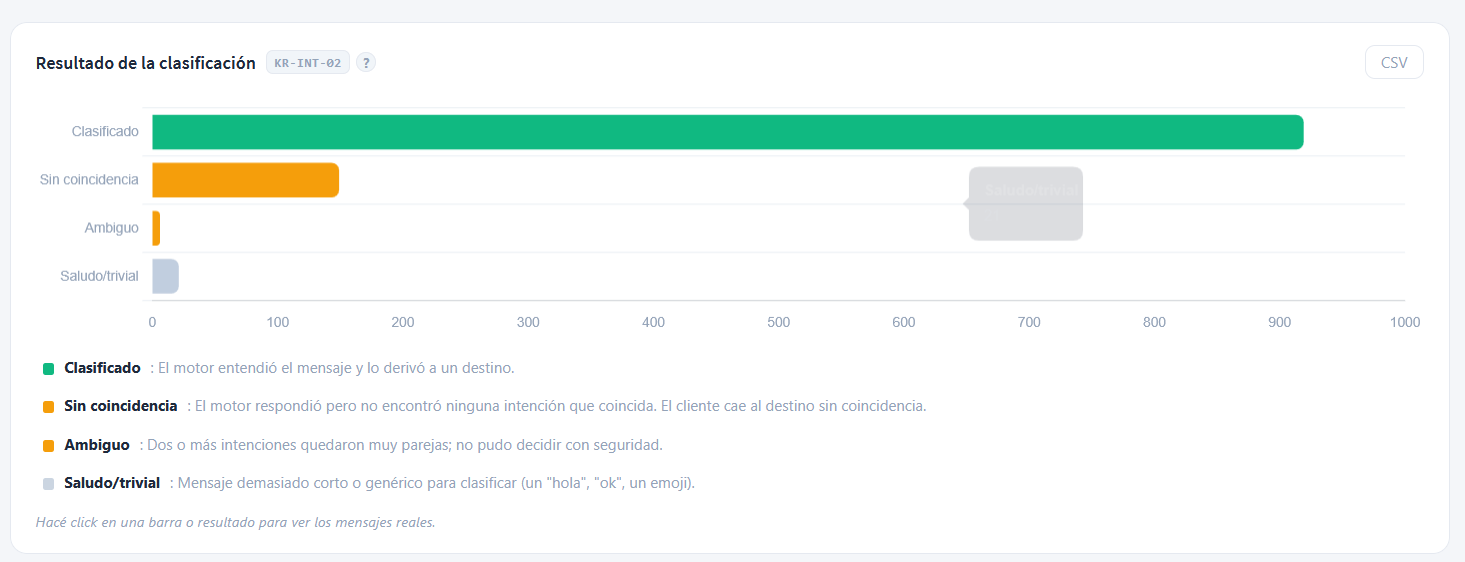
What each classification attempt ended in, in horizontal bars by reason:
- Classified (green): the engine understood the message and routed it to a destination.
- No match (orange): it responded but found no applicable intent; the customer falls to the no-match destination (usually a group).
- Ambiguous (orange): two or more intents came out too close and it couldn't decide with confidence.
- Greeting/trivial (grey): a message too short or generic to classify (a "hi", "ok", an emoji).
Click a bar to see the actual messages that fell into that category. The key read is the share of orange: a lot of "No match" or "Ambiguous" points to an intent catalog that's incomplete or has overlapping descriptions.
By intent / item
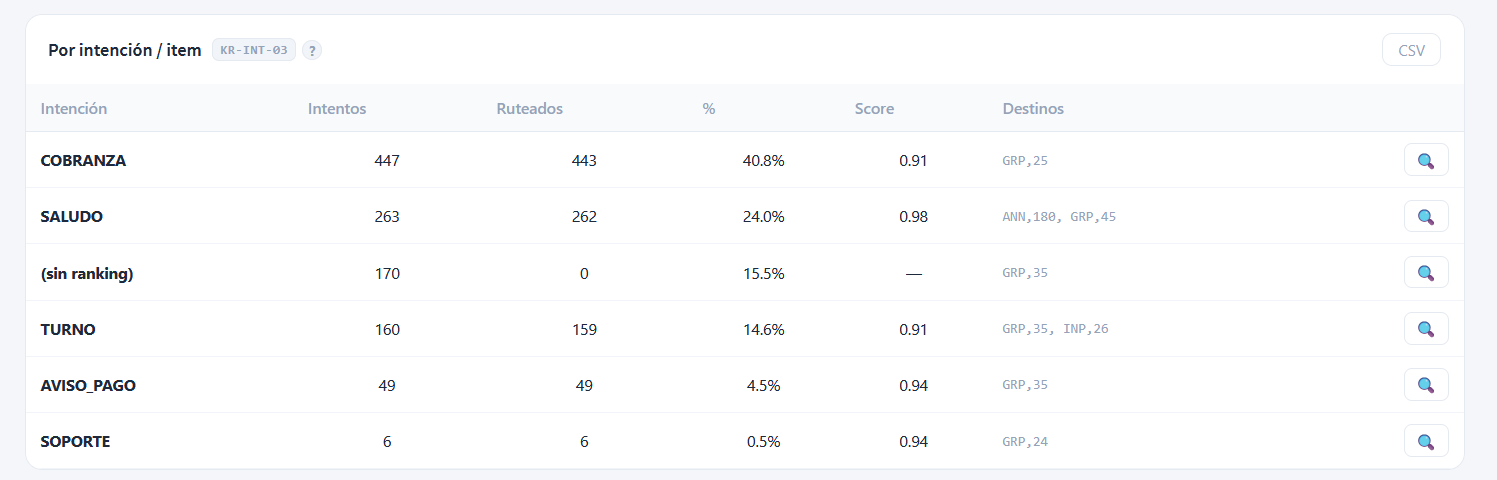
A table with each intent in the catalog: Attempts (how many times it was evaluated), Routed (how many times it won and routed), % of the total, average Score of confidence, and the Destinations it sent to (in TYPE,ID format, for example GRP,25). The magnifier on the right opens the actual messages for that intent.
Useful for tuning the catalog. An intent with many attempts but few routed isn't matching well: its description is vague or overlaps with another. The (no ranking) row is the messages that matched no intent: candidates to add as a new intent.
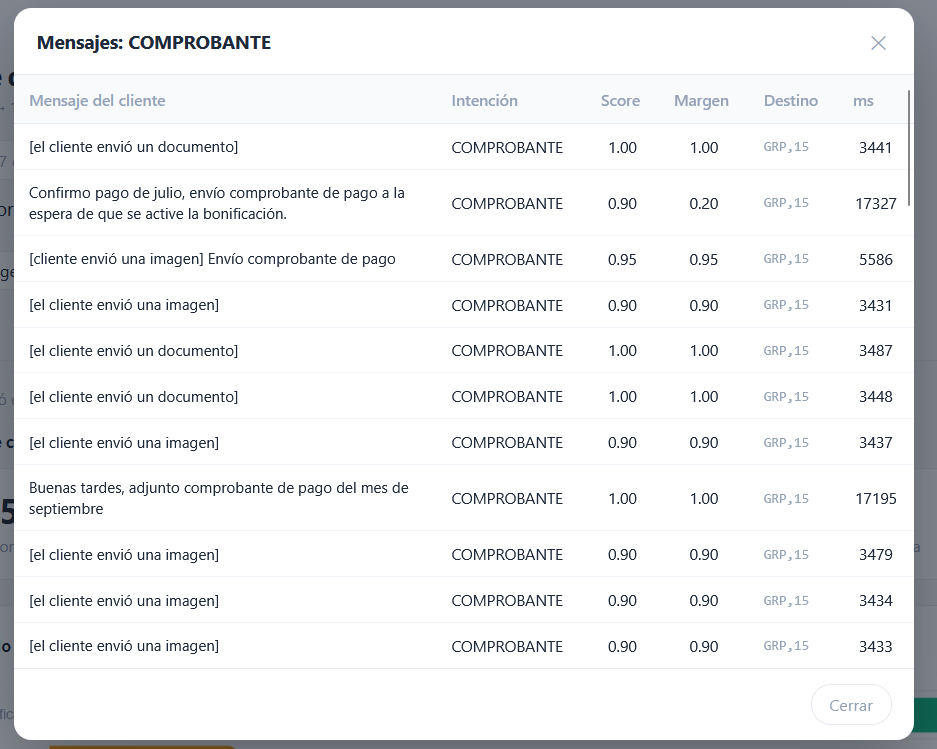
Opening the magnifier shows, message by message: the customer text, the winning intent, the score, the margin over the second option, the destination and the engine time in ms. It's the raw evidence behind the number, useful for understanding why the engine decided what it decided.
Retry and recovery

What happened with the messages that were not understood on the first try: Tickets with retry (where there was at least one failure), Recovered (they ended up classifying on a later attempt), Fell to a human (they exhausted retries and were routed to the no-match destination) and Recovery rate.
This block explains why the raw match rate (KR-INT-01) is misleading. The typical pattern is a customer who writes "hi" (doesn't classify), and in the next message writes what they need (classifies). What matters operationally isn't how many classifications failed, but how many tickets ended up not understood and fell to a human - that's the column to watch. A high recovery rate means the engine recovers on its own and bothers the customer less.
AI Analysis
These reports come from the AI analysis of closed conversations. Some conversations may not be analyzed yet, so each block shows a coverage indicator.
Coverage
The coverage X% label says what part of the range has analysis available. With low coverage, the percentages are indicative: they're computed over the analyzed part, not the total.
Customer emotion
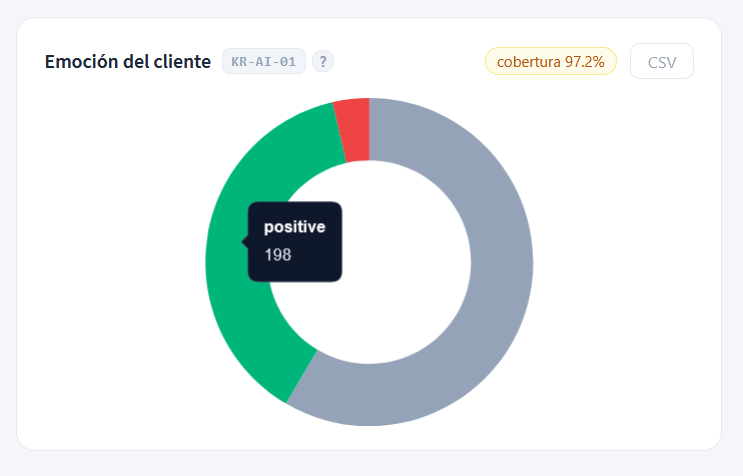
Distribution of the tone detected in conversations, as a ring: positive (green), neutral (grey), negative (red) and mixes. The tooltip gives the count per category.
It's a thermometer of the conversation climate. A jump in the negative slice between periods is worth looking at together with Contact reason (KR-AI-03): it usually coincides with a specific issue (an outage, a cut, a price increase).
Resolution
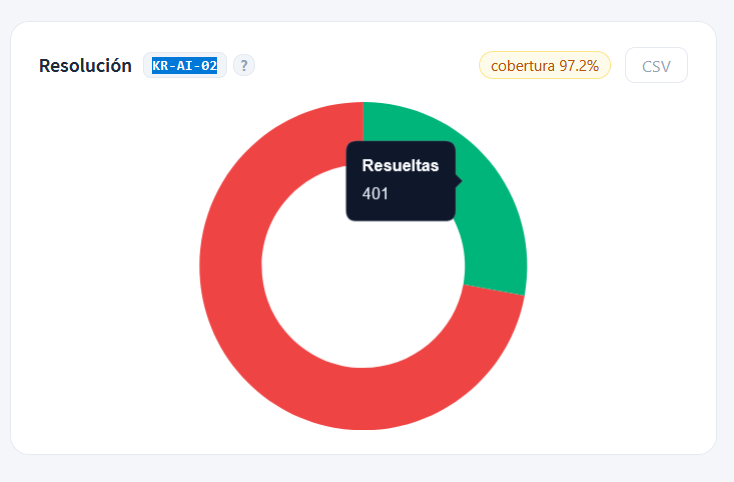
Share of conversations the analysis marked as Resolved vs Unresolved, as a ring. The tooltip gives the count.
It's a read of effectiveness distinct from the operational close: a conversation can be closed in the system yet marked unresolved by the analysis (the customer left without what they came for). A high share of unresolved is a sign of flows or answers that don't quite resolve.
Contact reason (AI)
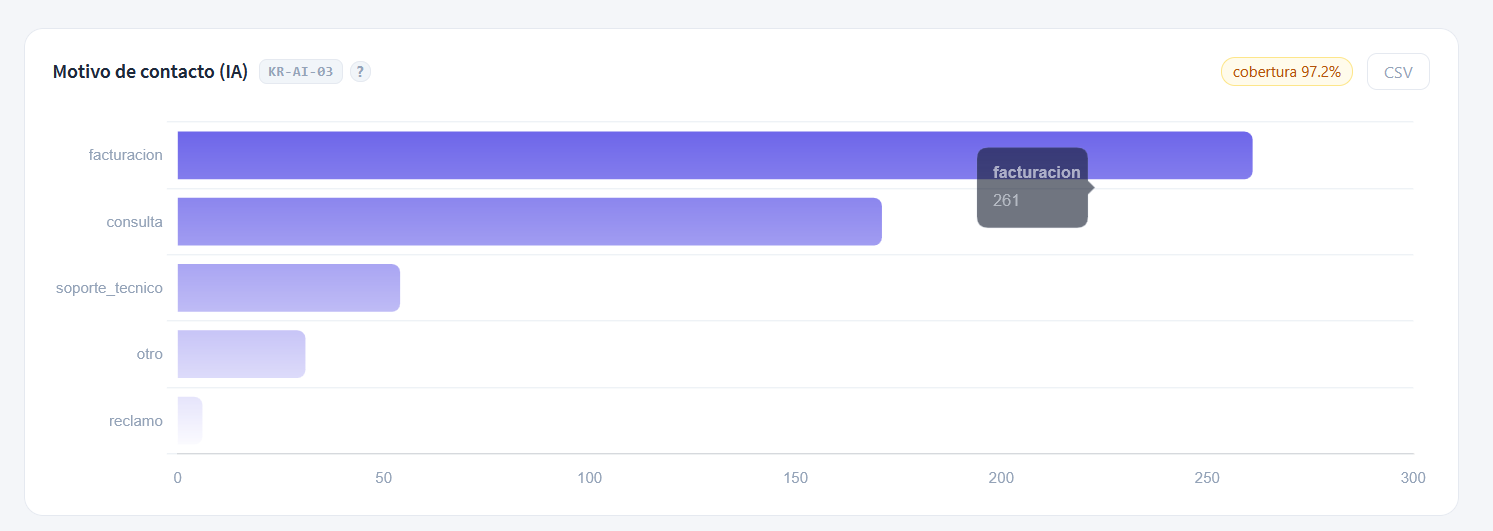
The most frequent topics customers write about, according to the AI analysis, in horizontal bars ordered by volume (billing, inquiry, technical support, etc.). The tooltip gives the count per topic.
Unlike By reason / tag (KR-DIS-04), which depends on agents tagging by hand, this comes from the automatic analysis, so it covers even conversations without a tag. It's the best read of "what people are talking about" and where to reinforce the bot or the intent catalog.